Components
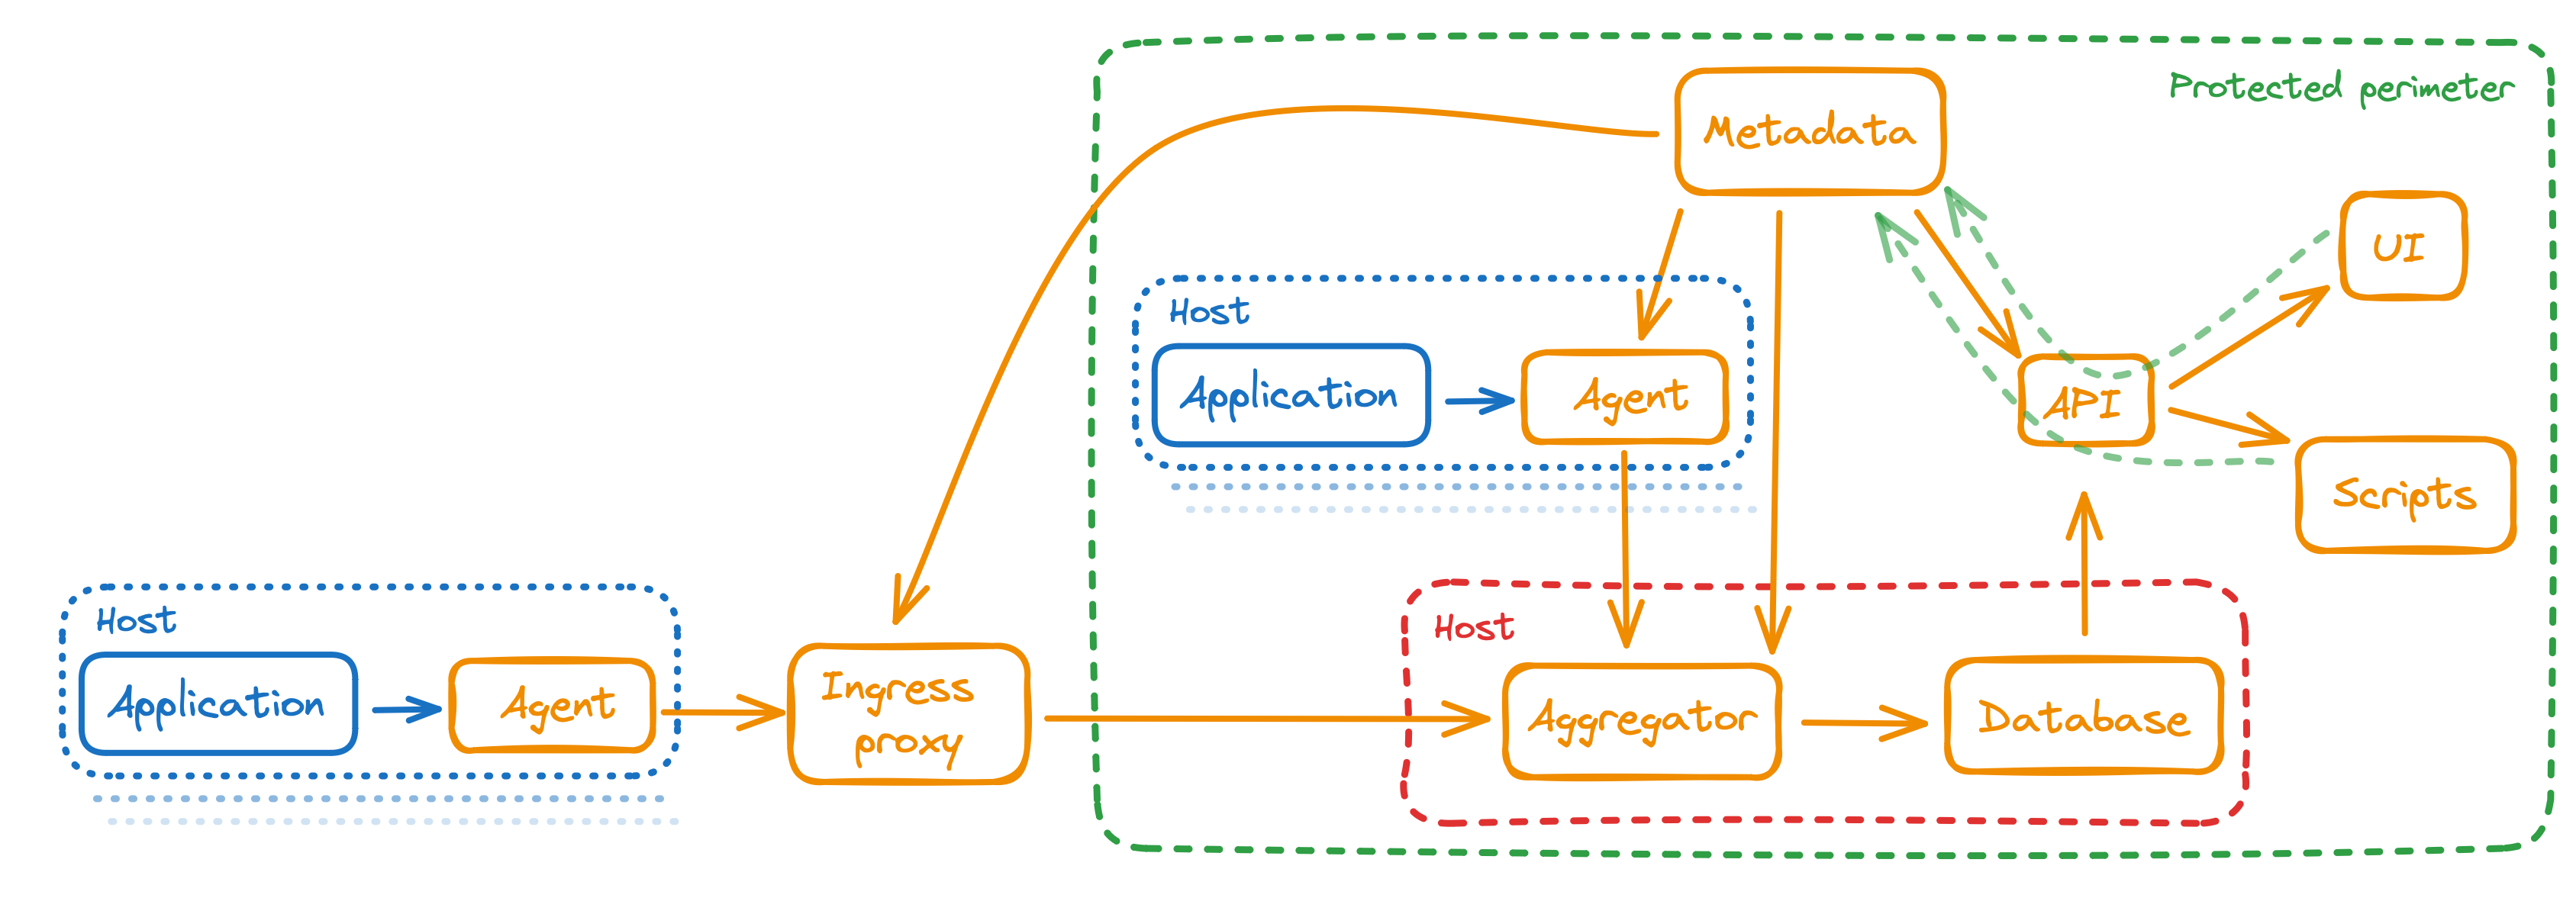
Find basic StatsHouse components in the picture:
Check the descriptions below:
- Agent
- Aggregator
- Database
- Application programming interface (API)
- User interface (UI)
- Ingress proxy
- Metadata
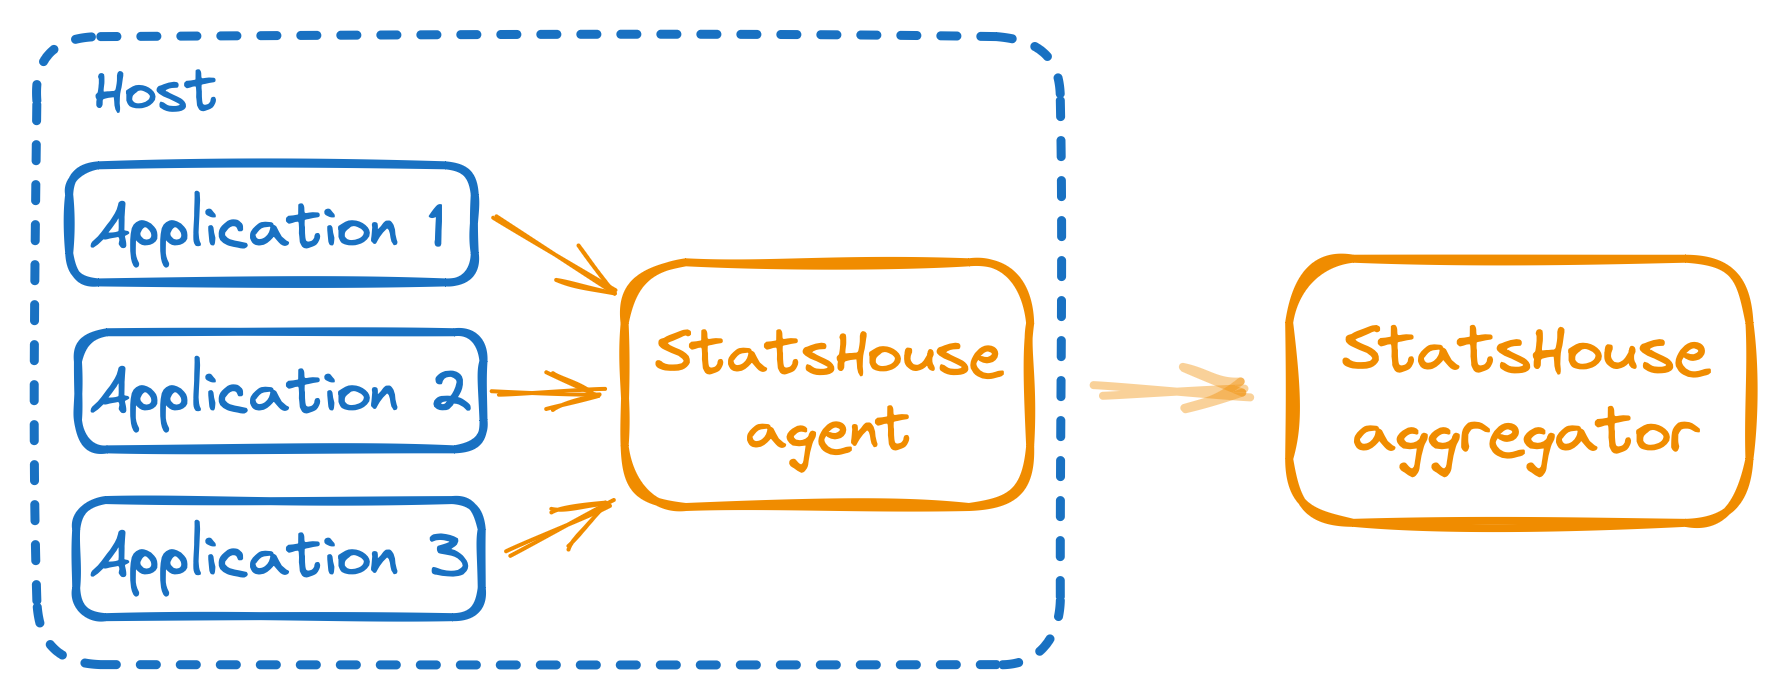
Agent
The agent
- validates metric data (e.g., if a metric exists),
- aggregates data over a second,
- determines how to shard data,
- and sends data to aggregators.
If aggregators are unavailable, the agent stores data on a local disk within the quota and sends it later.
An agent receives metric data via UDP. Supported formats are
Receiving data via UDP
StatsHouse receives data via UDP in the MessagePack, Protocol Buffers, JSON, and TL formats—they are semantically identical. It automatically detects the format by the first bytes in the packet.
Find the schemes for TL, MessagePack, and Protocol Buffers:
- TL
- MessagePack
- Protocol Buffers
---types---

statshouse.metric#3325d884 fields_mask:#
name:    string
tags:    (dictionary string)
counter: fields_mask.0?double
ts:      fields_mask.4?#               // UNIX timestamp UTC
value:   fields_mask.1?(vector double)
unique:  fields_mask.2?(vector long)

= statshouse.Metric;

---functions---

// for smooth JSON interoperability, first byte of tag must not be 0x5b or 0x7b ("[" or "{")
// for smooth MessagePack interoperability, first byte of tag must be less than 0x80
// for smooth ProtoBuf interoperability, first byte must be as large as possible.

@write statshouse.addMetricsBatch#56580239 fields_mask:# metrics:(vector statshouse.metric) = True;
  metrics: [
    {
      ts:   1670673392,     # uint32, UNIX timestamp in seconds (optional)
      name: "foobar",       # string([a-zA-Z][a-zA-Z0-9_]*), metric name
      tags: {
        "env":              # string([a-zA-Z][a-zA-Z0-9_]*), tag name
          "production"      # string(printable UTF-8),       tag value
      },
      counter: 100500.1,    # float64,        number of observed events
      value:   [0.7],       # array(float64), observed values array
      unique:  [591068825], # array(int64),   observed IDs array
    }
  ]
}
syntax = "proto3";
package statshouse;

option go_package = "github.com/vkcom/statshouse/internal/receiver/pb";

message Metric {
    string              name    = 1;
    map<string, string> tags    = 2;
    double              counter = 3;
    uint32              ts      = 4;  // UNIX seconds UTC
    repeated double     value   = 5;
    repeated int64      unique  = 6;
}

message MetricBatch {
    repeated Metric metrics = 13337;  // to autodetect packet format by first bytes
}

// to compile
// sudo apt-get install libprotobuf-dev
// go install google.golang.org/protobuf/cmd/protoc-gen-go
// ~/go/src/github.com/vkcom/statshouse$ protoc -I=internal/receiver --go_out=../../../../.. statshouse.proto

// to compile if proto3 format not supported, for example by protocute

// 1. comment out line: option go_package = "github.com/vkcom/statshouse/internal/receiver/pb";
// 2. add
// message MapFieldEntry {
//   optional string key = 1;
//   optional string value = 2;
// }
// 3. replace Metric with
// message Metric {
// string              name    = 1;
// map<string, string> tags    = 2;
// double              counter = 3;
// uint32              ts      = 4;  // UNIX seconds UTC
// repeated double     value   = 5;
// repeated int64      unique  = 6;
// }
// 4. ./protocute --cpp_out=. ~/go/src/github.com/vkcom/statshouse/internal/receiver/statshouse.proto
A packet is an object with an array of metrics inside:
{"metrics":[ ... ]}
Each element in this array is an object with the fields:
{
 "name":"rpc_call_latency",  // metric name (obligatory)
 "tags":{"protocol": "tcp"}, // tags
 "ts": 1630000000,           // timestamp; 0 and no timestamp means "now"
 "counter": 6,               // event counter
 "value": [1, 2.0, -3.0],    // values if any (do not use with "unique")
 "unique": [15, 18, -60]     // unique counters if any (do not use with "value")
}
For example, one can send a packet like this:
{"metrics":[
{"name":"rpc_call_latency",
 "tags":{"protocol": "tcp"},
 "value": [15, 18, 60]},
{"name": "rpc_call_errors",
 "tags":{"protocol": "udp","error_code": "-3000"},
 "counter": 5}
]}
{"metrics":[
{"name": "external_landings",
 "tags":{"country": "ru","gender": "m","skey": "lenta.ru"},
 "counter": 1}
]}
Сheck the requirements for using formats.
- For TL: the packet body should be the Boxed-serialized
statshouse.addMetricsBatchobject. - For JSON: the first character should be a curly bracket
{(to detect the format correctly). - For Protocol Buffers: do not add fields to the
MetricBatchobject (to detect the format correctly).
Deploying agents in the Kubernetes pods
Please avoid deploying agents in the Kubernetes pods.
We strongly recommend deploying them on the real servers—make sure to specify the 13337 port.
The reason is that StatsHouse "does not like" the fluctuating number of agents. The agents send per-second reports to the aggregators. The permanent number of agents indicates that the agents are connected to the aggregators. The pods that stopped working reduce the number of agents and activate the main StatsHouse alert.
Details
With the VK RPC protocol, StatsHouse gets the ephemeral connection keys using the remote and local IP addresses of the connection—as they are shown to the client and the server. Routing packets from one adapter to another via firewall makes establishing the connections impossible. To connect the Kubernetes-like components, create the virtual network adapters and connect them using the Linux network namespaces.
Aggregator
It aggregates per-second metric data from all the agents and inserts the resulting aggregation into the ClickHouse database.

There are as many aggregators as there are ClickHouse shards with replicas. Each aggregator inserts data to its local database replica deployed on the same machine. For example: 3 shards × 3 replicas = 9 aggregators.

Real-time and "historical" data
The aggregator has two "workflows":
- for real-time data,
- for "historical" data. The data is "historical" if it has not been sent immediately upon creating.
Inserting real-time data is the top priority for the aggregator.

Imagine the breakdown situation: it was impossible to insert data for a long time, then the system recovered. StatsHouse starts to insert real-time data immediately. As for the "historical" data, StatsHouse will insert it as soon as possible—if only it does not prevent real-time data from being inserted.
Details
Prioritizing real-time data in StatsHouse is related to the ClickHouse database's way of inserting "historical" data, which is rather slow.
Real-time data
The aggregator allows agents to insert last 5-minute data—this is a "small" inserting window (customizable). If an agent was not able to insert data in time, it is required to send data as the "historical" one.
The aggregator keeps a container with statistics per each second—such a container aggregates data from the agents. As soon as the next second data arrives, the aggregator inserts this data (from the "small" window) into the database. And the agents receive the response with the insert result.
The "small" window extends to the future for 2 seconds. It helps the agents to insert data correctly if their clock is going too fast.
"Historical" data
The aggregator allows agents to insert last 48-hour data—this is a "large" inserting window (customizable).
If the data is older than 48 hours, StatsHouse records meta-statistics, and throws away this piece of data. The agent
receives the OK response.
The between-host aggregation is really important, so StatsHouse does its best to make it possible:
This algorithm helps the most distant ("oldest") seconds to come up with the "newest" ones. It makes aggregating historical data possible and helps to insert data simultaneously.
Handling aggregator's shutdown
If the aggregator is unavailable or responds with an error, the agent stores data on a local disk. Storing data on a disk is limited in bytes. It is also limited in time—within the "large" (48-hour) inserting window.
Details
Distributing data between the replicas
If it is unacceptable or impossible to access the disk, one may run the agent with the empty --cache-dir argument.
StatsHouse will not use the disk. The "historical" data will be stored in memory—while the aggregators are
unavailable, i.e., for several minutes.
If the aggregator is unavailable, the agents send data to the rest of the replicas. The data is distributed according to the seconds' ordinal numbers: the even seconds are sent to one of the replicas, the odd seconds are sent to another. So the load for both increases by 50%. This is one of the reasons to support writing data to exactly three ClickHouse replicas.
Handling double inserts
If the aggregator responds with an error, the agent sends data to another aggregator (another replica) on the other host. For deduplication, we need a consensus algorithm, which is a rather complicated thing.
In StatsHouse, the main and the back-up aggregators can insert data from the same agent at the same second.
For this rare case, we track the double inserts via the __heartbeat_version meta-metric, which is the number of
agents sending data at the current second. To make this meta-metric stable during normal aggregators' operation,
the agents send data every second—even if there is no real user data at the moment.
Database
The ClickHouse database stores aggregated metric data.
StatsHouse inserts metric data into the ClickHouse table having the following definition:
CREATE TABLE statshouse2_value_1s (
    `time`           DateTime,
    `metric`         Int32,
    `tag0`           Int32,
    `tag1`           Int32,
...
    `tag15`          Int32,
    `stag`           String,
    `count`          SimpleAggregateFunction(sum, Float64),
    `min`            SimpleAggregateFunction(min, Float64),
    `max`            SimpleAggregateFunction(max, Float64),
    `sum`            SimpleAggregateFunction(sum, Float64),
    `max_host`       AggregateFunction(argMax, Int32, Float32),
    `percentiles`    AggregateFunction(quantilesTDigest(0.5), Float32),
    `uniq_state`     AggregateFunction(uniq, Int64)
) ENGINE = *MergeTree
PARTITION BY toDate(time) ORDER BY (metric, time,tag0,tag1, ...,tag15, stag);
If writing percentiles is not enabled for a metric, or the metric is not a
unique counter, the corresponding table columns (percentiles or uniq_state) are empty.
If a metric is a simple counter, all the columns are empty except the count
one. The stag column is not empty only if a metric has a String top tag.
To get data for time intervals longer than a second, StatsHouse aggregates data within them and produces per-minute and per-hour aggregates.
Details
Data is distributed across the ClickHouse shards using the hash of metric, key0, … , key15.
If a metric has multiple tags, its data related to a particular tag (i.e., "protocol":"tcp") are usually stored on
different shards. To get the full statistics, one should always make distributed queries to the whole set of shards.
What is the reason for it? The set of tag values has a certain cardinality: there is a finite number of possible tag value combinations for a metric. If we reach this cardinality limit, i.e., we send all these tag value combinations, the amount of data stops increasing due to aggregation—StatsHouse aggregates the events with the same tag value combination.
To store the sample of data for the whole metric, each shard should store as many rows as there are tag value combinations for a metric—not a part proportional to a number of shards.
StatsHouse does not use buffer tables—each aggregator inserts data once per second. Data is inserted into the
incoming table. The data is filtered by time within a receive window (48 hours) and copied via the meterialized
view. It prevents StatsHouse from inserting the "garbage" data. Otherwise, ClickHouse should have read data not
from one or two partitions but from all of them.
A shard should have three or more replicas. Aggregators insert data into the first three replicas. The rest ones are read-only replicas and may be used to scale the reading load.
The number of shards can be any. To prevent incorrect configuration and inconsistent sharding, which may lead to a sharp increase in the amount of data due to weak aggregation, agents send the number of a replica shard to the aggregator. If the aggregator is not the right recipient for this data, it responds with an error. The same number helps the ingress proxy to forward data to the right aggregator.
Application programming interface (API)
Find StatsHouse OpenAPI specification.
The thin API client allows StatsHouse to send efficient queries to the database. The service caches data to minimize a database load. We limit retrieving data directly from ClickHouse as much as possible, since ineffective queries can negatively impact the ClickHouse cluster.
User interface (UI)
A user interface retrieves data from the StatsHouse API and displays metric data in a graph view.
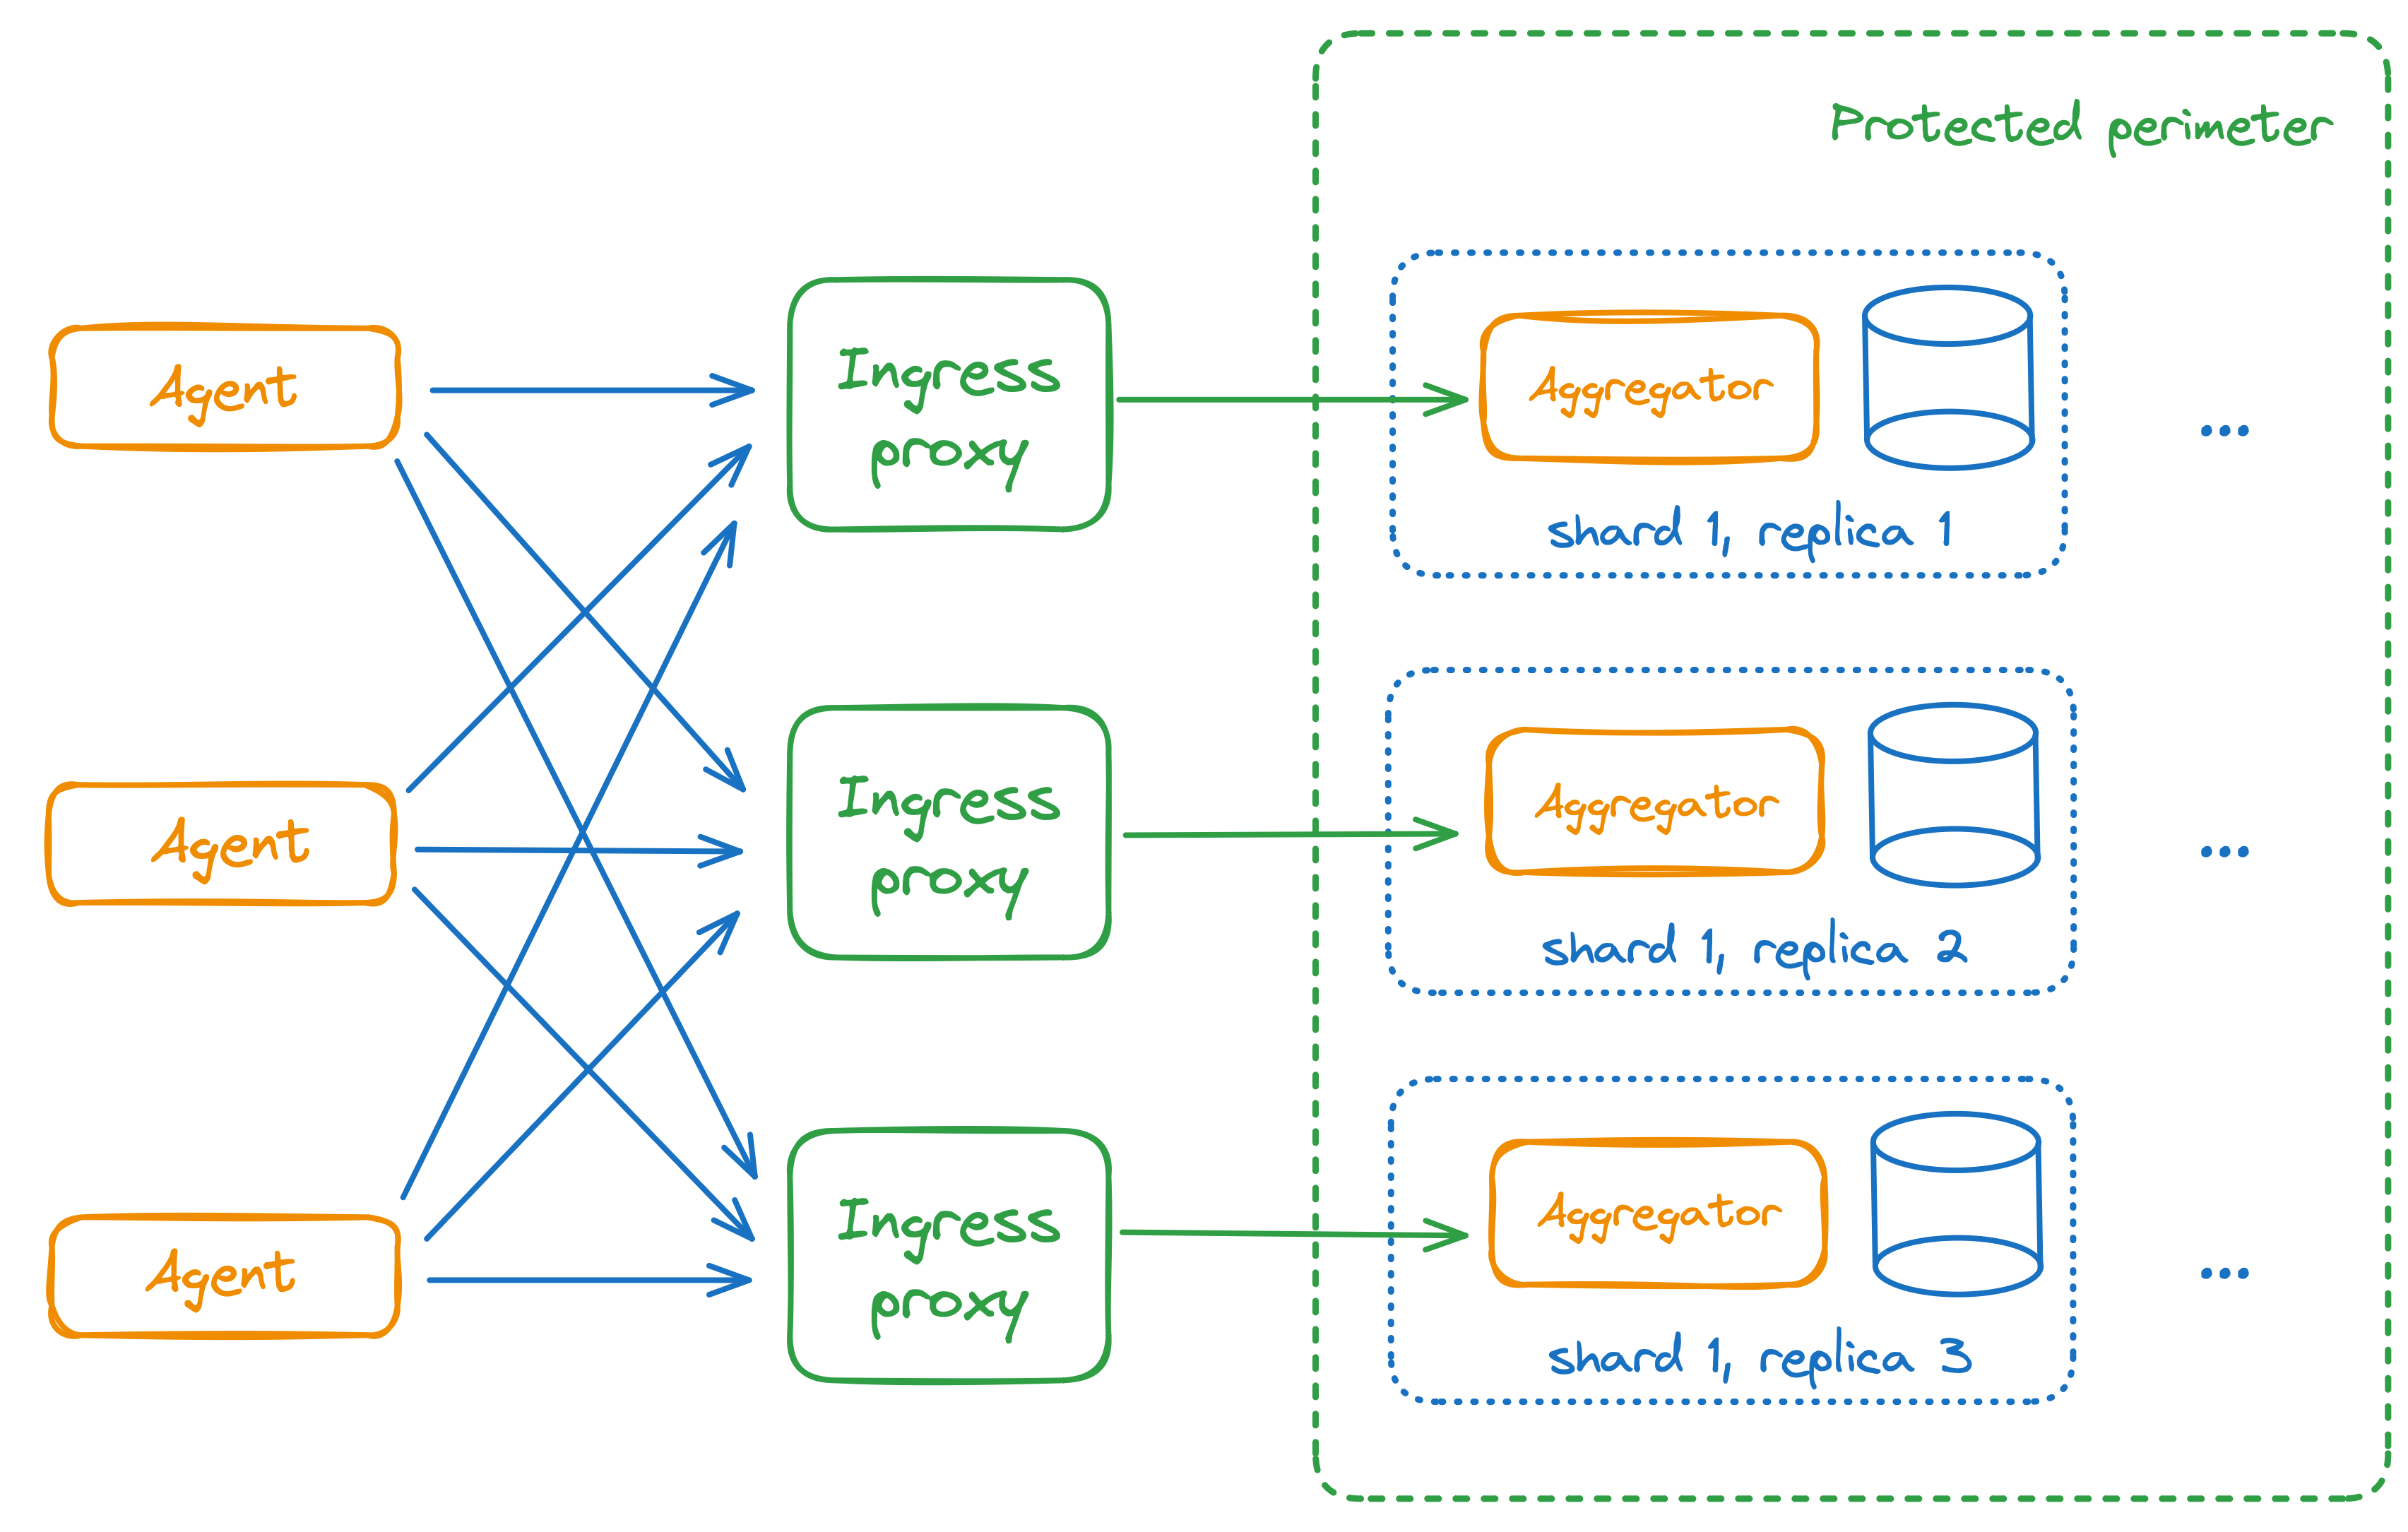
Ingress proxy
An ingress proxy receives data from the agents that live outside the protected perimeter (i.e., outside the data center) and sends it to the aggregators.
Agents and aggregators use the TL/RPC protocol with the data center encryption key. So, the agents outside the data center cannot connect to aggregators directly, because it would require disclosing or copying the key to the external systems.
The ingress proxy has a separate set of encryption keys for the external connections. To revoke the encryption key, one should delete it from the ingress proxy configuration.
Ingress proxy does not have a state. To reduce the likelihood of an attack, it proxies only the subset of TL/RPC request types used by the aggregators.
There should be exactly three ingress proxies. Each of them is a proxy to a corresponding replica of a shard. If the proxy is unavailable due to service or shutdown, it is equivalent to a breakdown of one shard's replica and does not affect the normal operation of the StatsHouse system.
Three ingress proxy instances simulate aggregators. One can set up one more ingress proxy level behind the existing proxies. This level will use the previous ingress proxies as the aggregators.
Please avoid deploying ingress proxies in the Kubernetes pods.
Details
Cryptokeys
StatsHouse uses the VK RPC protocol with the (optional) encryption to connect the components.
According to the VK RPC protocol, the cryptokey is both the login for getting access and the secret for getting the ephemeral connection keys. To establish a connection, the client has to use one of the keys known to a server. The central system component is the aggregators. Upon startup, they get the single "major" data center cryptokey.
To connect to aggregators, the agents should get the parameters:
-agg-addr=X—the addresses of the first aggregators' shards;-aes-pwd-file=X—the "major" data center cryptokey.The mechanism above is secure only inside the protected perimeter. To connect from the outside, use the ingress proxy installed at the border.
This ingress proxy at the border has two parts:
For the ingress proxy, one should configure the parameters:
-ingress-external-addr—the proxies' external addresses the agents use for connection;-ingress-addr=X—the parameter to control the interfaces for connecting agents.-aes-pwd-file=X—the inner cryptokey for sending data to the aggregators,-ingress-pwd-dir=X—a set of the external keys for the agents from the remote sites.The -ingress-addr=X parameter is usually :8128 that is the same as 0.0.0.0:8128.
It also may contain the subnet address of the network adapter to make it the
only gateway for connections. The port in the -ingress-addr=X parameter should match one of the ports in the
-ingress-external-addr parameter. The "outer" part of the ingress proxy should be available to the agents via
these ports.
Each of these files contains the cryptokey; the file name is ignored and regarded as a comment.
The keys have random length—four bytes at least. The first four bytes are for key identification, so they must not
be identical.
If the external keys in the directory are changed, restart the ingress proxy. The ingress proxy does not keep track of this directory, because the external keys in the set are changed rarely.
Each agent gets one of the keys from the ingress proxy's -ingress-pwd-dir=X directory as the -aes-pwd-file=X
parameter.
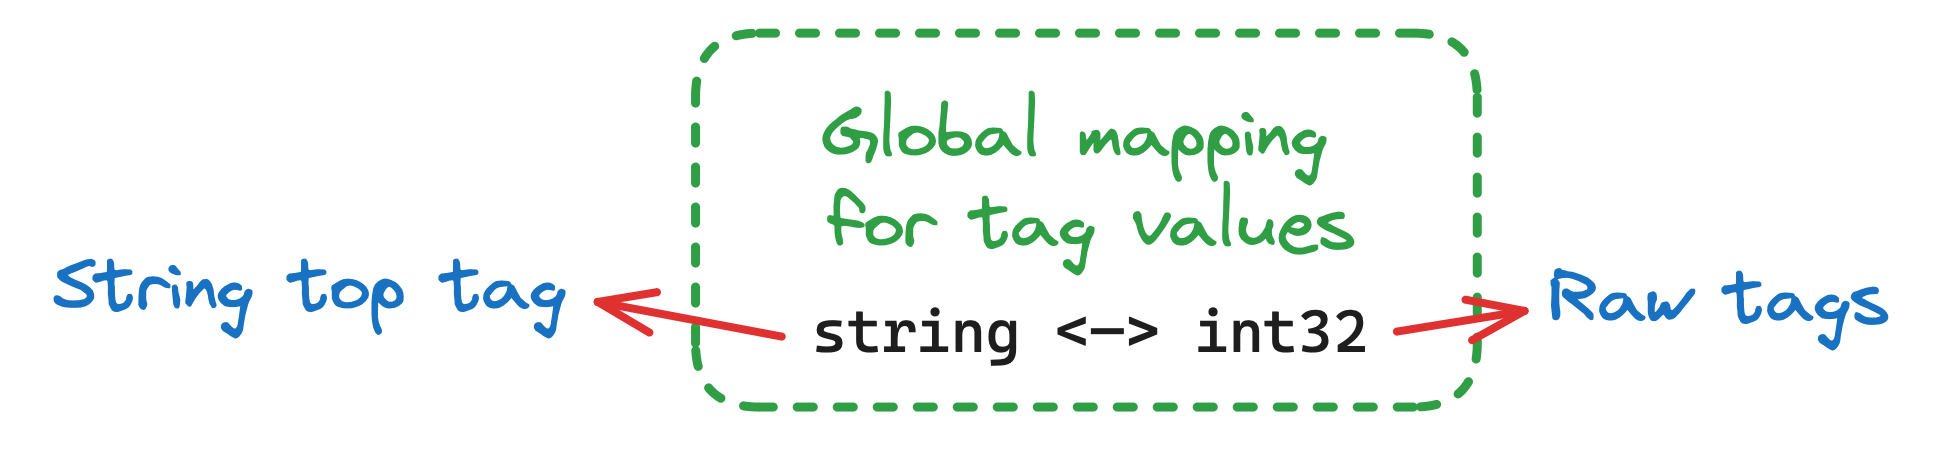
Metadata
The metadata component stores the global string↔int32 map—it maps the metric names and
the tag values, which are strings, to integers.
StatsHouse is known for providing real-time data. To provide users with low latency, StatsHouse maps the
string tag values (as well as metric names) to int32 values:
    'iphone' <=> 12
    'null' <=> 26
This huge string↔int32 map is common for all metrics. The elements of this map are never deleted.
To prevent the uncontrollable increase of the string↔int32 map, the budgets for
creating metrics and tag values are limited.
The budget for creating tag values
To prevent the uncontrollable increase of the string↔int32 map, the budget for creating tag values is limited to
300 per day. Upon exceeding the budget, new mappings can be added twice per hour (this rule is customizable).
Mapping flood appears when you exceed this budget. When the budget is over and new mappings are not allowed,
StatsHouse inserts a service mapping flood value to a tag column not to lose the entire event.
There are options to use tags with too many different values and to avoid the mapping flood: String top tag and Raw tags.
If you need a tag with many different 32-bit integer values (such as user_ID), use the
Raw tag values to avoid the mapping flood.
For many different string values (such as search_request), use a String top tag.
String top tag
The String top tag stands apart from the other ones as its values are not mapped to integers. It is a separate
stag column in the ClickHouse table:
| timestamp | metric | tag_1 | tag_2 | counter | sum | min | max | |
|---|---|---|---|---|---|---|---|---|
| 13:45:05 | toy_packets_size | JSONint32 | okint32 | my-tag-valueint32 | 100 | 1300 | 20 | 1200 |
As the non-mapped strings take up a lot of space and are longer to read, StatsHouse limits their number (e.g., to a hundred). This limit is not configurable for users.
For these String top tag values, StatsHouse stores only the most frequently used ones—those with the highest counter. The other tag values for this metric become empty and are aggregated.
For example, the limitation for the non-mapped strings is 4, and we have the following metric data:
| timestamp | metric | tag_1 | tag_2 | counter | sum | min | max | |
|---|---|---|---|---|---|---|---|---|
| 13:45:05 | toy_metric | ... | ... | a | 100 | ... | ... | ... |
| 13:45:05 | toy_metric | ... | ... | b | 3 | ... | ... | ... |
| 13:45:05 | toy_metric | ... | ... | c | 100 | ... | ... | ... |
| 13:45:05 | toy_metric | ... | ... | d | 88 | ... | ... | ... |
The next piece of data adds one more row: with the e String top tag value and the counter equal to 5.
The String top mechanism chooses the tag value with the lowest count (b is the less popular one) and makes it
empty:
| timestamp | metric | tag_1 | tag_2 | counter | sum | min | max | |
|---|---|---|---|---|---|---|---|---|
| 13:45:05 | toy_metric | ... | ... | a | 100 | ... | ... | ... |
| 13:45:05 | toy_metric | ... | ... | b → empty string | 3 | ... | ... | ... |
| 13:45:05 | toy_metric | ... | ... | c | 100 | ... | ... | ... |
| 13:45:05 | toy_metric | ... | ... | d | 88 | ... | ... | ... |
| 13:45:05 | toy_metric | ... | ... | e | 55 | ... | ... | ... |
The next piece of data adds one more row: with the f tag value and the counter equal to 2.
| timestamp | metric | tag_1 | tag_2 | counter | sum | min | max | |
|---|---|---|---|---|---|---|---|---|
| 13:45:05 | toy_metric | ... | ... | a | 100 | ... | ... | ... |
| 13:45:05 | toy_metric | ... | ... | empty string | 3 | ... | ... | ... |
| 13:45:05 | toy_metric | ... | ... | c | 100 | ... | ... | ... |
| 13:45:05 | toy_metric | ... | ... | d | 88 | ... | ... | ... |
| 13:45:05 | toy_metric | ... | ... | e | 55 | ... | ... | ... |
| 13:45:05 | toy_metric | ... | ... | f → empty string | 2 | ... | ... | ... |
As the f tag value is not in the top of the frequently used ones (i.e., it has the low count), it becomes the
empty string too and is aggregated with the previous empty string:
| timestamp | metric | tag_1 | tag_2 | counter | sum | min | max | |
|---|---|---|---|---|---|---|---|---|
| 13:45:05 | toy_metric | ... | ... | a | 100 | ... | ... | ... |
| 13:45:05 | toy_metric | ... | ... | empty string | 3+2 | ... | ... | ... |
| 13:45:05 | toy_metric | ... | ... | c | 100 | ... | ... | ... |
| 13:45:05 | toy_metric | ... | ... | d | 88 | ... | ... | ... |
| 13:45:05 | toy_metric | ... | ... | e | 55 | ... | ... | ... |
Raw tags
If tag values in your metric are originally 32-bit integer values, you can mark them as the Raw ones
to avoid the mapping flood.
These Raw tag values will be parsed as (u)int32 (-2^31..2^32-1 values are allowed)
and inserted into the ClickHouse database as is.
Learn how to set up Raw tags.
The budget for creating metrics
Users can create as many metrics as they wish as soon as they do it manually via the StatsHouse UI. As a rule, administrators cannot automate creating metrics.
The StatsHouse components rely on the idea that there are not so many different metrics—hundreds of thousands as a maximum. StatsHouse is not protected from the uncontrollable increase of the metrics' number.
If you migrate to StatsHouse from the other monitoring solution, contact the StatsHouse administrators in your organization to enable the "Auto-create" mode (and to disable it upon migration).
Details
Getting metric properties from metadata
Aggregators get information directly from the metadata service. Agents deal with the mappings via the aggregators. Both the agents and the aggregators cache the mappings in memory or in files—for a month.
Upon initial startup, the agents use the special bootstrap request to get the 100,000 most frequently used mappings. Otherwise, while deploying the agents on the 10,000 hosts, StatsHouse should have downloaded a billion values one by one. It would take a lot of time, and StatsHouse would not be able to write metric data.
Aggregators use the TL/RPC long polling to get metrics' information from metadata. Similarly, agents use long polling to get information from aggregators. So, all the agents become informed about the changes in the metrics' properties almost immediately (in a second).
Deleting metrics
One cannot delete a metric, because there is no efficient way to do it in the ClickHouse database.
StatsHouse uses the visible flag to disable the metric, i.e., to hide the metric from the metric list
(it is reversible). Disabling a metric stops writing data for it to the database.